2. Computational Complexity
In the last chapter we developed a drawing program. To hold the drawing commands we built the PyList container class which is a lot like the built-in Python list class, but helps illustrate our first data structure. When we added a drawing command to the sequence we called the append method. It turns out that this method is called a lot. In fact, the flower picture in the first chapter took around 700 commands to draw. You can imagine that a complex picture with lots of free-hand drawing could contain thousands of drawing commands. When creating a free-hand drawing we want to append the next drawing command to the sequence quickly because there are so many commands being appended. How long does it take to append a drawing command to the sequence? Can we make a guess? Should we care about the exact amount of time?
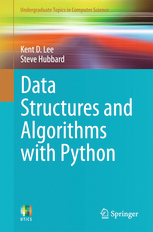
In this chapter you’ll learn how to answer these questions and you’ll learn what questions are important for you as a computer programmer. First you’ll read about some principles of computer architecture to understand something about how long it takes a computer to do some simple operations. With that knowledge you’ll have the tools you’ll need to make informed decisions about how much time it might take to execute some code you have written.
2.1. The PlotData Program
You can download the program by clicking here. This program is used to plot data written in the plot XML format presented in the text. The next program, the list timing access program, writes data in the plot XML format.
  1import turtle
  2import tkinter
  3import tkinter.colorchooser
  4import tkinter.filedialog
  5import tkinter.messagebox
  6import xml.dom.minidom
  7import math
  8import sys
  9
 10class PlotApplication(tkinter.Frame):
 11    currentFile = None # used for the reload feature
 12    def __init__(self, master=None, datafile=None):
 13        super().__init__(master)
 14        self.datafile = datafile
 15        self.pack()
 16        self.buildWindow()
 17
 18
 19    def buildWindow(self):
 20
 21        self.master.title("Plot")
 22
 23        bar = tkinter.Menu(self.master)
 24        fileMenu = tkinter.Menu(bar,tearoff=0)
 25        open_button = None
 26
 27
 28        def loadFile(filename=None):
 29
 30            if filename == None:
 31                filename = tkinter.filedialog.askopenfilename(title="Select a Plot File", filetypes=[("Extensible Markup Language", ".xml")])
 32
 33            if filename == None or filename == '':
 34                return
 35
 36            if open_button: open_button.destroy()
 37
 38            self.currentFile = filename
 39
 40            try:
 41
 42                theTurtle.clear()
 43                theTurtle.penup()
 44                theTurtle.goto(0,0)
 45                theTurtle.pendown()
 46                screen.update()
 47                theTurtle.color("black")
 48
 49                xmldoc = xml.dom.minidom.parse(filename)
 50
 51                plotElement = xmldoc.getElementsByTagName("Plot")[0]
 52
 53                attr = plotElement.attributes
 54                self.master.title(attr["title"].value)
 55
 56                axesElement = plotElement.getElementsByTagName("Axes")[0]
 57
 58                xAxisElement = axesElement.getElementsByTagName("XAxis")[0]
 59                xAxisLabel = xAxisElement.firstChild.data.strip()
 60
 61                yAxisElement = axesElement.getElementsByTagName("YAxis")[0]
 62                yAxisLabel = yAxisElement.firstChild.data.strip()
 63
 64                xAttr = xAxisElement.attributes
 65                yAttr = yAxisElement.attributes
 66
 67                minX = float(xAttr["min"].value)
 68                maxX = float(xAttr["max"].value)
 69                minY = float(yAttr["min"].value)
 70                maxY = float(yAttr["max"].value)
 71
 72                xSize = maxX - minX
 73                ySize = maxY - minY
 74                xCenter = xSize / 2.0 + minX
 75
 76                xPlaces = max(4-round(math.log(xSize,10)),0)
 77                yPlaces = max(4-round(math.log(ySize,10)),0)
 78
 79                labelYVal = maxY - 0.10 * ySize
 80
 81                screen.setworldcoordinates(minX-0.20 * xSize,minY - 0.20 * ySize, \
 82                    maxX + 0.20 * xSize,maxY + 0.20 * ySize)
 83
 84                theTurtle.ht()
 85
 86                theTurtle.penup()
 87                theTurtle.goto(minX,minY)
 88                theTurtle.pendown()
 89                theTurtle.goto(maxX,minY)
 90                theTurtle.penup()
 91                theTurtle.goto(minX,minY)
 92                theTurtle.pendown()
 93                theTurtle.goto(minX,maxY)
 94                theTurtle.penup()
 95
 96                theTurtle.goto(xCenter, minY - ySize * 0.10)
 97                theTurtle.write(xAxisLabel,align="center",font=("Arial",14,"bold"))
 98
 99                theTurtle.goto(minX, maxY + 0.05 * ySize)
100                theTurtle.write(yAxisLabel,align="center",font=("Arial",14,"bold"))
101
102                for i in range(0,101,10):
103                    x = minX + xSize * i / 100.0
104                    y = minY + ySize * i / 100.0
105
106                    theTurtle.penup()
107                    theTurtle.goto(x,minY+ySize * 0.025)
108                    theTurtle.pendown()
109                    theTurtle.goto(x,minY-ySize * 0.025)
110                    theTurtle.penup()
111                    theTurtle.goto(x,minY-ySize * 0.05)
112
113                    theTurtle.write(("%1."+str(xPlaces)+"f")%x,align="center", \
114                        font=("Arial",12,"normal"))
115
116                    theTurtle.penup()
117                    theTurtle.goto(minX+xSize * 0.025, y)
118                    theTurtle.pendown()
119                    theTurtle.goto(minX-xSize * 0.025, y)
120                    theTurtle.goto(minX-xSize * 0.001, y)
121                    theTurtle.write(("%1."+str(yPlaces)+"f")%y,align="right", \
122                        font=("Arial",12,"normal"))
123
124
125                sequences = plotElement.getElementsByTagName("Sequence")
126
127                for sequence in sequences:
128                    attr = sequence.attributes
129
130                    label = attr["title"].value.strip()
131                    color = attr["color"].value
132                    theTurtle.color(color)
133                    theTurtle.penup()
134                    theTurtle.goto(xCenter,labelYVal)
135                    labelYVal -= 0.10 * ySize
136                    theTurtle.write(label,align="center",font=("Arial",14,"bold"))
137
138                    dataPoints = sequence.getElementsByTagName("DataPoint")
139
140                    first = dataPoints[0]
141                    attr = first.attributes
142                    x = float(attr["x"].value)
143                    y = float(attr["y"].value)
144                    theTurtle.goto(x,y)
145                    theTurtle.dot()
146                    theTurtle.pendown()
147
148                    for dataPoint in dataPoints:
149                        attr = dataPoint.attributes
150                        x = float(attr["x"].value)
151                        y = float(attr["y"].value)
152                        theTurtle.goto(x,y)
153                        theTurtle.dot()
154
155                    screen.update()
156            except Exception as ex:
157                tkinter.messagebox.showerror('Error Reading File', 'There was an error reading the XML plot data:\n' + str(ex))
158                print("The error from reading the plot data.")
159                print(repr(ex))
160
161        def reloadFile():
162            if self.currentFile != None: loadFile(self.currentFile)
163
164        open_button = tkinter.Button(self.master, text='Load Plot Data', width=20,
165             height=5, bd='10', command=loadFile)
166        open_button.place(relx=0.5, rely=0.5, anchor=tkinter.CENTER)
167
168        fileMenu.add_command(label="Load Plot Data...",command=loadFile)
169
170        fileMenu.add_command(label="Reload Plot Data...",command=reloadFile)
171
172        fileMenu.add_command(label="Exit",command=self.master.quit)
173
174        bar.add_cascade(label="File",menu=fileMenu)
175
176        self.master.config(menu=bar)
177
178        canvas = tkinter.Canvas(self,width=1000,height=800)
179        canvas.pack(side=tkinter.LEFT)
180
181        theTurtle = turtle.RawTurtle(canvas)
182
183        screen = theTurtle.getscreen()
184
185        screen.tracer(0)
186
187        if self.datafile != None:
188            loadFile(self.datafile.strip())
189
190def main():
191    root = tkinter.Tk()
192    datafile = None
193    if len(sys.argv) > 1:
194        datafile = sys.argv[1]
195    plotApp = PlotApplication(root, datafile)
196
197    plotApp.mainloop()
198    print("Program Execution Completed.")
199
200if __name__ == "__main__":
201    main()
2.2. List Access Timing
You can download the program by clicking here.
 1import datetime
 2import random
 3import time
 4
 5def main():
 6
 7    # Write an XML file with the results
 8    file = open("ListAccessTiming.xml","w")
 9
10    file.write('<?xml version="1.0" encoding="UTF-8" standalone="no" ?>\n')
11
12    file.write('<Plot title="Average List Element Access Time">\n')
13
14    # Test lists of size 1000 to 200000.
15    xmin = 1000
16    xmax = 200000
17
18    # Record the list sizes in xList and the average access time within
19    # a list that size in yList for 1000 retrievals.
20    xList = []
21    yList = []
22
23    for x in range(xmin, xmax+1, 1000):
24
25        xList.append(x)
26
27        prod = 0
28
29        # Creates a list of size x with all 0's
30        lst = [0] * x
31
32        # let any garbage collection/memory allocation complete or at least
33        # settle down
34        time.sleep(1)
35
36        # Time before the 1000 test retrievals
37        starttime = datetime.datetime.now()
38
39        for v in range(1000):
40            # Find a random location within the list
41            # and retrieve a value. Do a dummy operation
42            # with that value to ensure it is really retrieved.
43            index = random.randint(0,x-1)
44            val = lst[index]
45            prod = prod * val
46        # Time after the 1000 test retrievals
47        endtime = datetime.datetime.now()
48
49        # The difference in time between start and end.
50        deltaT = endtime - starttime
51
52        # Divide by 1000 for the average access time
53        # But also multiply by 1000000 for microseconds.
54        accessTime = deltaT.total_seconds() * 1000
55
56        yList.append(accessTime)
57
58    file.write('  <Axes>\n')
59    file.write('    <XAxis min="'+str(xmin)+'" max="'+str(xmax)+'">List Size</XAxis>\n')
60    file.write('    <YAxis min="'+str(min(yList))+'" max="'+str(60)+'">Microseconds</YAxis>\n')
61    file.write('  </Axes>\n')
62
63    file.write('  <Sequence title="Average Access Time vs List Size" color="red">\n')
64
65    for i in range(len(xList)):
66        file.write('    <DataPoint x="'+str(xList[i])+'" y="'+str(yList[i])+'"/>\n')
67
68    file.write('  </Sequence>\n')
69
70    # This part of the program tests access at 100 random locations within a list
71    # of 200,000 elements to see that all the locations can be accessed in
72    # about the same amount of time.
73    xList = lst
74    yList = [0] * 200000
75
76    time.sleep(2)
77
78    for i in range(100):
79        starttime = datetime.datetime.now()
80        index = random.randint(0,200000-1)
81        xList[index] = xList[index] + 1
82        endtime = datetime.datetime.now()
83        deltaT = endtime - starttime
84        yList[index] = yList[index] + deltaT.total_seconds() * 1000000
85
86    file.write('  <Sequence title="Access Time Distribution" color="blue">\n')
87
88    for i in range(len(xList)):
89        if xList[i] > 0:
90            file.write('    <DataPoint x="'+str(i)+'" y="'+str(yList[i]/xList[i])+'"/>\n')
91
92    file.write('  </Sequence>\n')
93    file.write('</Plot>\n')
94    file.close()
95
96if __name__ == "__main__":
97    main()
2.3. The PyList Datatype
This is the chapter 2 version of this datatype. In chapter 4 another, more complete version of this datatype is described. You can download the chapter 2 version of the datatype by clicking here.
 1class PyList:
 2    # The size below is an initial number of locations for the list object. The
 3    # count instance variable keeps track of how many elements are currently stored
 4    # in the list since self.items may have empty locations at the end.
 5    def __init__(self,size=5):
 6        self.items = [None] * size
 7        self.count = 0
 8
 9    def append(self,item):
10        if self.count == len(self.items):
11            # We must make the list bigger by allocating a new list and copying
12            # all the elements over to the new list.
13            newitems = [None] * self.count * 2
14            for k in range(len(self.items)):
15                newitems[k] = self.items[k]
16
17            self.items = newitems
18
19        self.items[self.count] = item
20        self.count += 1
21
22def main():
23    p = PyList()
24
25    for k in range(100):
26        p.append(k)
27
28    print(p.items)
29    print(p.count)
30    print(len(p.items))
31
32if __name__ == "__main__":
33    main()
2.4. Figures from Text
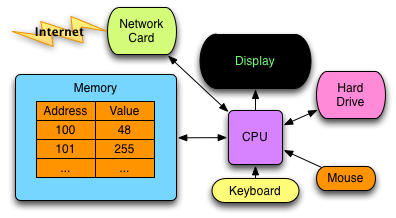
Fig. 1: Conceptual View of a Computer
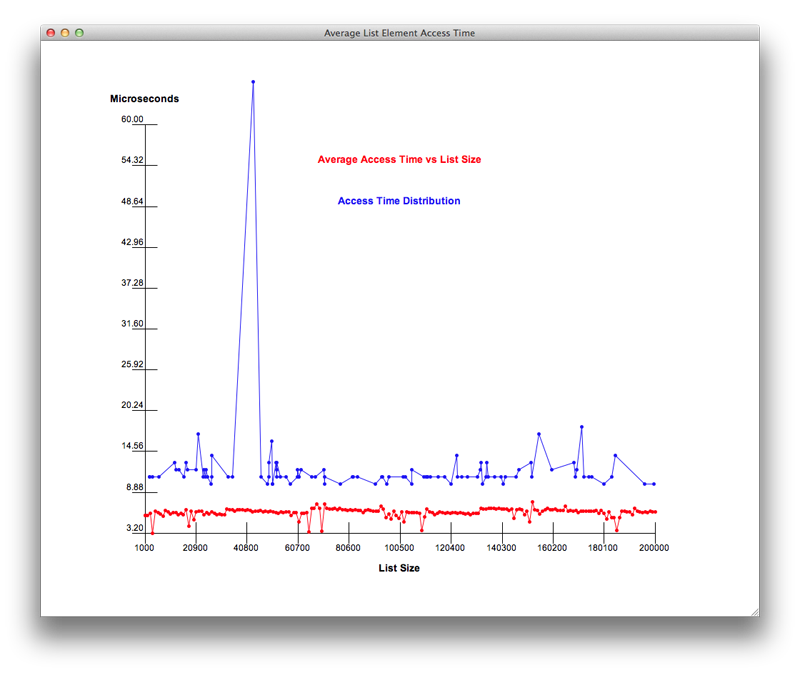
Fig. 2: Access Times in a Python List
Fig. 3: An Upper Bound
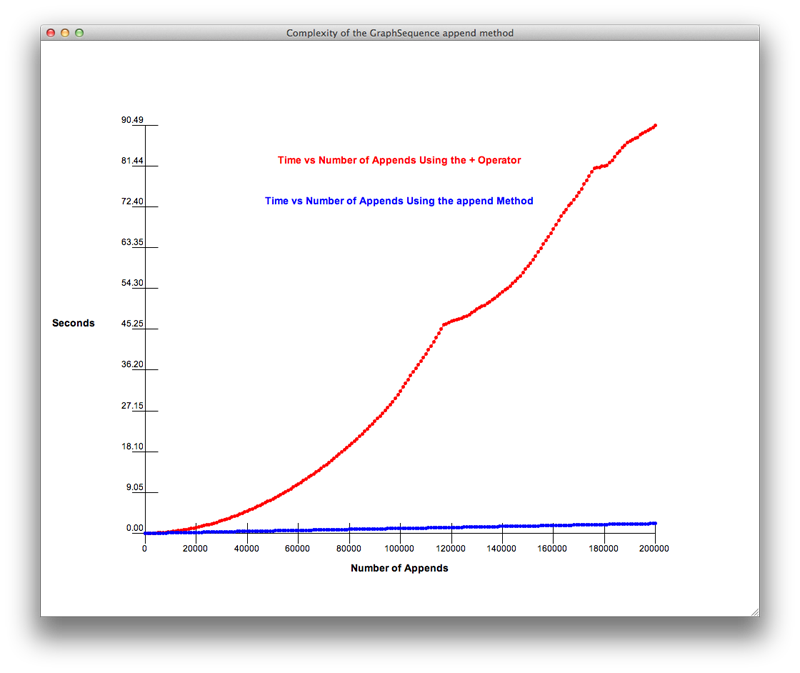
Fig. 4: The Complexity of Appending to a PyList
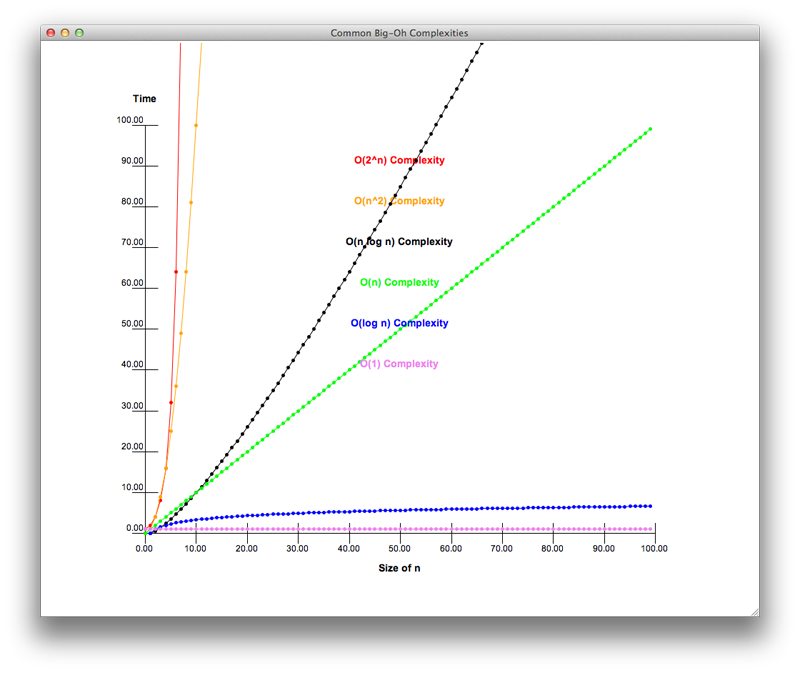
Fig. 5: Common Big-Oh Complexities
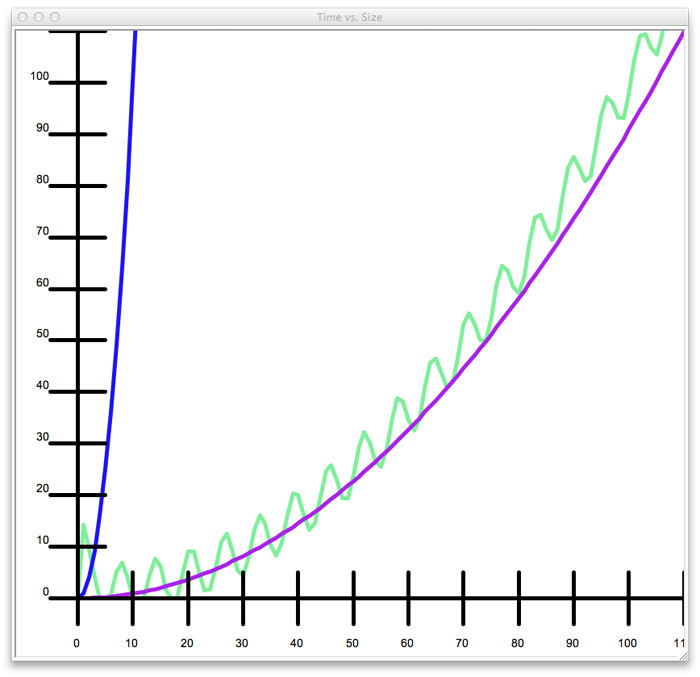
Fig. 6: A Lower and Upper Bound
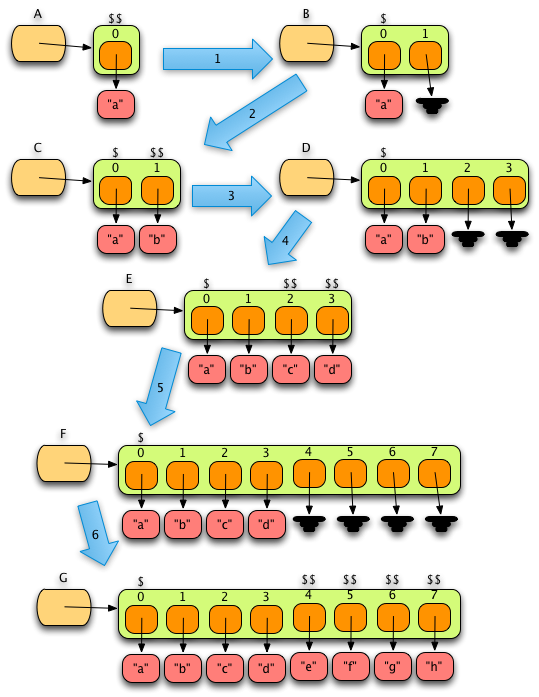
Fig. 7: Append Cyber Dollars